MS SQL Server サンプルデータの AdventureWorksDW2019 スキーマを使って T-SQL を覚えるメモ。
ファクトテーブルの dbo.FactInternetSales と関連ディメンションテーブルを結合してカテゴリ別の売上データを抽出するクエリ
with t1 as (
    SELECT
        s.[ProductKey],
        s.[CustomerKey],
        d.[FullDateAlternateKey],
        s.[SalesOrderNumber],
        s.[SalesOrderLineNumber],
        s.[OrderQuantity] * s.[UnitPrice] as revenue,
        pc.[EnglishProductCategoryName] as category,
        psc.[EnglishProductSubcategoryName] as subcategory,
        p.[EnglishProductName] as productname
    FROM
        [dbo].[FactInternetSales] as s
        inner join [dbo].[DimDate] as d on s.[OrderDateKey] = d.[DateKey]
        inner join [dbo].[DimProduct] as p on s.[ProductKey] = p.[ProductKey]
        left join [dbo].[DimProductSubcategory] as psc on p.[ProductSubcategoryKey] = psc.[ProductSubcategoryKey]
        left join [dbo].[DimProductCategory] as pc on psc.[ProductCategoryKey] = pc.[ProductCategoryKey]
    where
        1 = 1
        and s.[OrderDate] between '2013-01-01' and '2013-12-31'
)
select
    coalesce(t1.[category], 'all') as category,
    coalesce(t1.[subcategory], 'all') as subcategory,
    sum(t1.[revenue]) as revenue
from
    t1
group by
    rollup(t1.[category], t1.[subcategory]);
結果はこうなる。
GROUP BY ROLLUP 関数が超便利。
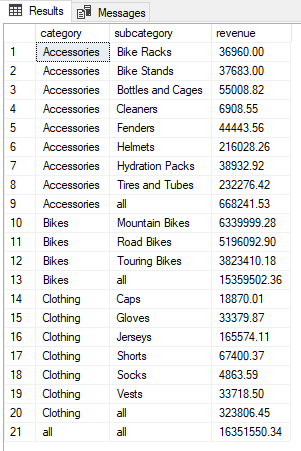
ROLLUP 関数でカテゴリ・サブカテゴリ別に集計
PowerBI で表示するとこうなる。
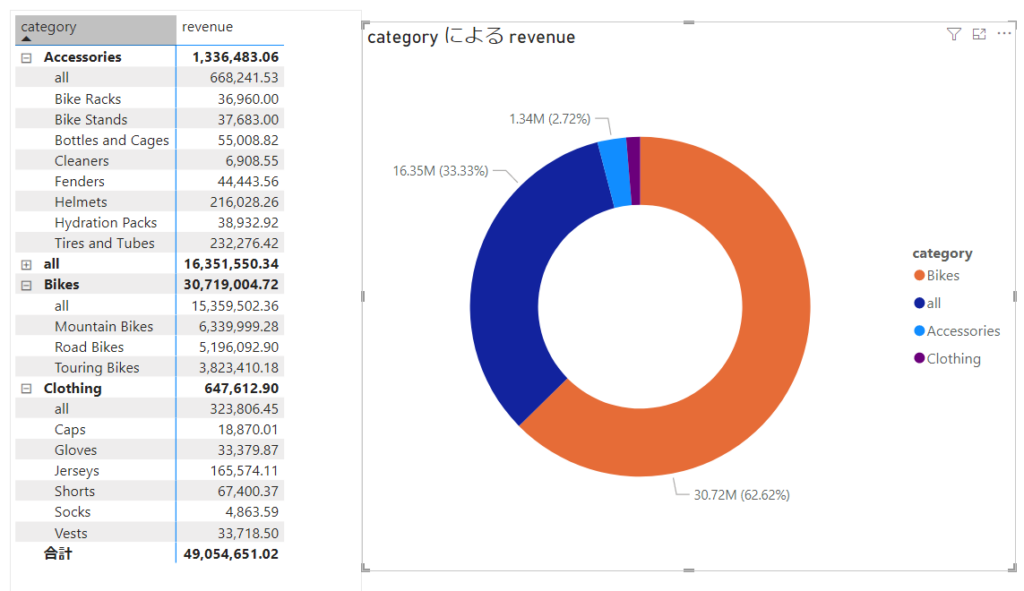
PowerBI で可視化
参考図書
ビッグデータ分析・活用のためのSQLレシピ
SQL Server 2016の教科書 開発編